How to Calculate Vacation Rental Profitability — Property by Property
Vacation rental profitability is a narrower question than it sounds. This guide stays at the operating level: what a property earned in a period, what operating costs were recorded against it, and what is left. It is not investment underwriting — there is nothing here about financing, appreciation, returns, or tax treatment. The practical thesis is simple: two properties can produce similar revenue and still produce different operating profit once expenses are attributed to the right property.
To calculate vacation rental profitability at the operating level, take the revenue recorded for a property in a period and subtract the operating expenses recorded against that same property and period. Net profit is the result, profit margin expresses it as a percentage of recorded revenue, and profit per booked night divides it by the nights booked. Revenue metrics such as ADR and occupancy describe revenue performance rather than profitability.
What does vacation rental profitability actually mean?
Revenue and profit answer different questions. Revenue is what guests paid you. Profit is what remains after the costs of running the property are subtracted from it. A month can set a revenue record and still leave less behind than the month before.
At the operating-record level, profitability begins with what a property earned in a period minus the operating expenses recorded against that property in the same period. That framing keeps the question answerable from records you already create, rather than from estimates.
This is why a strong nightly rate or a well-booked calendar does not settle the question on its own. A property can be busy and priced well while turnover cleaning, repairs, restocking, utilities, and service fees absorb much of what came in. Revenue performance and operating profitability can move in different directions.
Scope matters too. Investment analysis — financing costs, purchase price, long-run returns, tax treatment — is a separate exercise with different inputs, and it belongs with the professionals who handle it. Everything below stays inside operations: recorded revenue, recorded operating expenses, and what those two produce per property.
Start with recorded revenue
Profitability starts on the revenue side, and the useful unit is the booking rather than the month. Each stay belongs to a property and to dates; once both are recorded, revenue can be placed in a period and in a location without guesswork.
It helps to keep revenue components separate rather than blended into one figure:
- Nightly revenue. What the nights themselves earned. This is the component that pairs with booked nights, so keeping it distinct is what makes a nightly-rate figure meaningful later.
- Cleaning-fee revenue. If you charge and record a cleaning fee separately, keep it separate. It is guest-paid revenue, and a related cleaning cost may sit opposite it.
- Other recorded guest-paid revenue. Pet fees, extra-guest charges, and similar items where your operation records them. Kept separate, they explain why a month's revenue moved.
- Adjustments and refunds. Cancellations, partial refunds, and similar changes, where they are part of what you record. Absorbing an adjustment silently into a booking amount makes the month hard to explain later.
Consistency of period and property
Two practical checks matter here. First, assign every booking to the property it belongs to. Second, use a consistent rule for which period a figure lands in, including for a stay that spans two months.
In Blueprint, that second question has a defined answer rather than a convention you have to remember: nightly revenue and booked nights are allocated to the individual nights that fall inside the selected reporting period, while a one-time cleaning fee and any additional revenue line items are attributed to the period containing check-in. Cancelled stays contribute nothing to recorded revenue.
Whatever system you use, a comparison depends on keeping the period and the property behind both numbers consistent.
Add the operating expenses that belong to that property
The expense side is where property attribution earns its keep. A cost recorded without a property can be counted in a portfolio total and still be invisible in the property comparison that would have explained it.
These are practical operating examples, not tax categories, and nothing here says anything about whether a cost is deductible or how it should be reported — that belongs with a qualified tax professional.
- Cleaning and turnover. Turnover cleans, deep cleans, and laundry service between guests.
- Supplies and consumables. Paper goods, toiletries, coffee, detergent, light bulbs, and restocking.
- Repairs and maintenance. Handyman visits, appliance repair, HVAC service, pest control, and replacements.
- Utilities. Electricity, gas, water, trash, internet, and property-tied services.
- Platform and software fees. Booking-platform charges, payment processing, and the tools you operate with.
- Insurance. Premiums for policies covering the property or the operation.
- Property services. Landscaping, snow removal, pool or hot-tub service, and recurring on-site work.
- Other operating costs. Anything that does not fit cleanly elsewhere. Use it sparingly and add a note.
Property-specific versus portfolio-wide costs
Some costs clearly belong to one property: its turnover clean, its water bill, its broken dishwasher. Others are genuinely portfolio-wide — software you run the whole business on, for example.
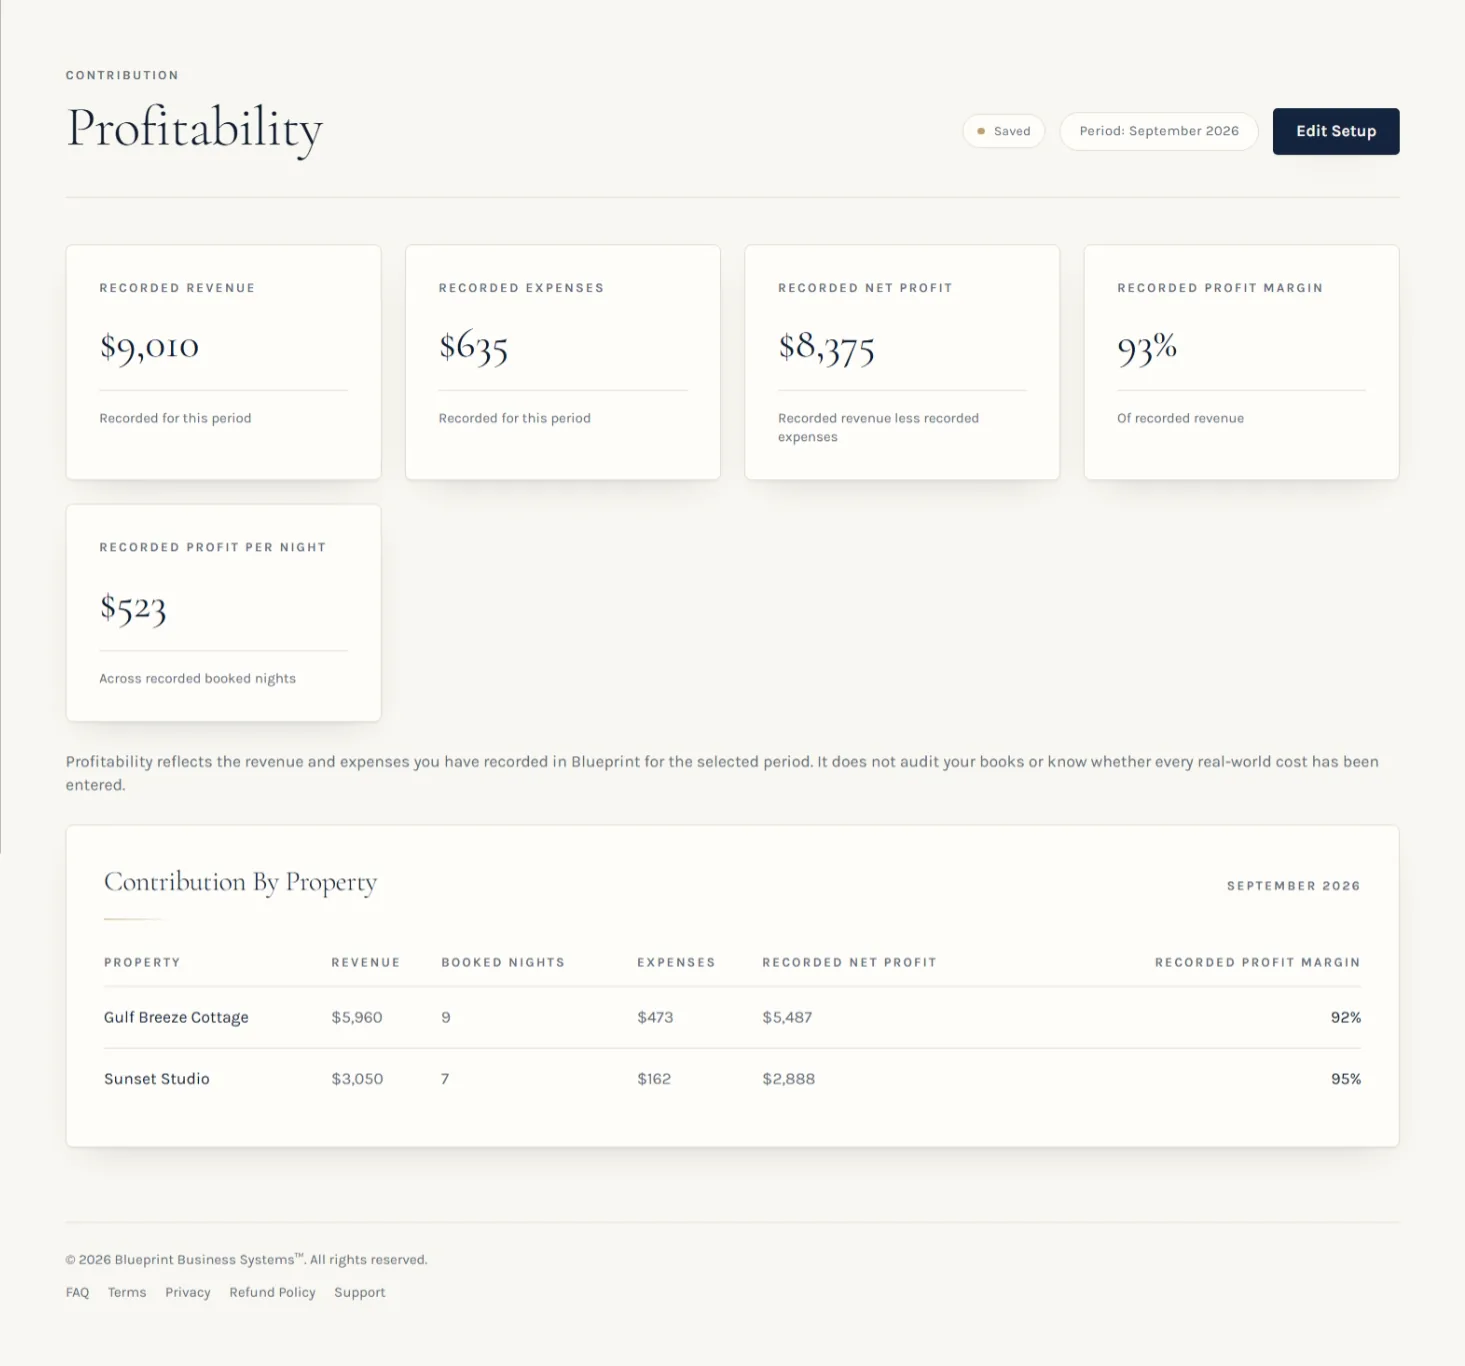
Both are real, and both matter to the business. The distinction is that only property-specific costs can be subtracted from one property's revenue without an allocation judgment. Blueprint keeps this honest by construction: a property's contribution row includes only expenses explicitly assigned to that property, and period expenses with no property — or with a property that no longer exists — appear in a separate reconciliation row rather than being spread across properties. Portfolio totals still include every recorded expense, so nothing goes missing and nothing is counted twice.
Calculate recorded net profit
At the operating level the calculation is deliberately plain: recorded revenue for the period minus recorded expenses for the period. Blueprint calls the result Recorded Net Profit, and it is exactly that subtraction — no allocations, no adjustments, and no attempt to be an accounting measure. It is not net operating income, and it is not an investment return figure.
An illustrative example, using invented numbers purely to show the arithmetic: a property records $6,400 of revenue for a month and $2,150 of operating expenses recorded against it. Recorded net profit is $4,250. Change nothing about revenue and add a $900 repair, and the same revenue month leaves $3,350.
One implementation detail is worth knowing, because it changes what you see. Blueprint reports Recorded Net Profit only when both revenue and expenses exist for the period and every revenue-producing property has at least one expense recorded. If a property earned revenue and has no expenses recorded, the portfolio profit figures are withheld and the view says the expense data is incomplete for that period, rather than showing a profit that is high only because costs are missing.
Calculate profit margin
Profit margin expresses profit as a share of revenue: recorded net profit divided by recorded revenue, shown as a percentage. That is precisely how Blueprint computes Recorded Profit Margin, and it is displayed as a rounded whole percentage of recorded revenue.
Margin adds context that a currency amount alone does not. Two months can both end with a similar amount left over while one required far more revenue to get there. A property with a smaller net figure can retain more of what it collects than a busier one.
Zero-revenue handling is explicit rather than implied: when recorded revenue for the period is zero — or when net profit itself is unavailable — Blueprint shows no margin instead of dividing by zero. The same applies per property: a property's margin appears only when it has recorded expenses and revenue above zero.
There is no universal target here, and this guide will not invent one. What a reasonable margin looks like depends on your market, property type, pricing approach, service level, and cost structure. The useful comparison is your own properties and your own periods, measured the same way.
Profit per booked night
Profit per booked night divides profit by the nights that actually earned it. In Blueprint, Recorded Profit Per Night is recorded net profit divided by recorded booked nights for the period — the same booked-night count used elsewhere in the period's figures — and it is withheld when there are no booked nights or when net profit is unavailable.
What it helps with is comparing properties or periods whose volume differs. A property with fewer nights can retain more per night than a property that stayed busier; the per-night view makes that visible where a monthly total can hide it.
What it does not tell you is equally worth stating. It says nothing about how many nights you could have sold, nothing about demand, nothing about whether a different rate would have produced a better month, and nothing about investment returns. It is a per-unit view of a recorded result, not a forecast.
ADR, occupancy, and RevPAR: useful, but not the same as profit
These three are revenue-performance concepts. They describe how effectively you converted your calendar into revenue. None of them includes an expense, so none of them answers the profitability question on its own.
ADR — average daily rate — is nightly revenue spread across booked nights. Blueprint's Recorded ADR is exactly that: period nightly room revenue divided by period booked nights, with cleaning fees and additional revenue excluded so the figure stays a nightly-rate figure. It is realised from recorded stays for the selected period, not the base rate saved during setup, and it is shown as unavailable when the period has no booked nights. Per property, the same definition applies to that property's room revenue and nights.
Occupancy describes how much of your available capacity was booked. Blueprint's Occupancy metric, shown on the Command Center for the reporting month, uses booked nights in the month as the numerator and the number of set-up properties multiplied by the calendar days in that month as the denominator, expressed as a rounded percentage and capped at 100%. That denominator is worth knowing before comparing the figure to anything published elsewhere, since availability conventions differ between systems.
RevPAR — revenue per available night — is an industry concept that combines rate and occupancy into a single revenue-efficiency figure. Blueprint does not currently calculate RevPAR, and this guide is not claiming it does. It is mentioned because you will encounter it, not because it is required here.
The distinction to carry forward: ADR, occupancy, and RevPAR measure revenue efficiency. Profitability needs the expense side too, and a property can look strong on all three while leaving less behind than another one.
How do you compare profitability property by property?
A portfolio total can conceal differences between properties. One property may carry more of the result while another contributes less, and the combined figure does not identify the reasons.
Consider two properties in one period, with illustrative figures. Both record about $6,000 of revenue. One is a two-bedroom with longer average stays: fewer turnovers, less cleaning, a quiet maintenance month — $1,900 of recorded expenses, leaving $4,100. The other takes shorter stays: more turnovers, more cleaning and restocking, plus a $700 appliance repair — $3,100 of recorded expenses, leaving $2,900. The same revenue with different recorded operating profit illustrates why property-level attribution matters.
That is the practical argument for attributing both sides. Revenue attribution alone tells you which property earned; expense attribution is what tells you which property kept it. When both carry a property, the comparison is a reading of your records rather than an estimate.
It also changes what you do next. Persistent turnover cost on one property is an operating question. A single large repair is a one-time item. The comparison points at which conversation to have, not at a verdict.
Common ways profitability gets distorted
These are practical risks to watch for rather than universal facts about every operation. Each one tends to make a period look better or worse than the records would otherwise support.
Missing expenses
A cost that was never recorded cannot reduce profit. An unrecorded cleaner payment or a supply run on a personal card makes a month look better than it was.
Expenses assigned to the wrong property
The portfolio total stays correct while both properties' contributions are wrong — one flattered, one penalised. This is easy to miss precisely because the total still reconciles.
Mixing setup rates with recorded results
A configured base rate or standard cleaning fee is a plan. What a stay actually earned is a result. Comparing one against the other produces a number that describes neither.
Treating deposits or payouts as the full revenue picture
Platform payouts can be net of fees and adjustments, and one deposit can span stays or periods. Useful as a source document; incomplete as a revenue record.
Ignoring one-time maintenance and repairs
A large repair can dominate a single month. Leaving it out overstates the month; failing to note that it was one-time can make the next comparison look like an improvement that never happened.
Combining all properties into one total
Portfolio-only reporting can hide a property that is not carrying its costs, sometimes for several periods.
Comparing periods without noticing timeframe or seasonality
A partial month, a different month length, or a seasonal swing can explain a change entirely. Check the period before interpreting the movement.
What does a simple monthly profitability review look like?
A short repeatable pass can reduce how much has to be reconstructed later. This is a practical completeness and review routine for your own records — not a bank reconciliation, and not an audit. Adapt it to your operation:
- Confirm which reporting period you are looking at, and that every figure on screen belongs to it.
- Review the reservations and revenue recorded for the period against what actually happened.
- Review recorded expenses for the period, including recurring costs that renew quietly.
- Verify the property assignment on every reservation and expense, including genuinely portfolio-wide costs.
- Scan for obvious problems: a missing cost, a duplicate entry, a property with revenue and no expenses.
- Read net profit, profit margin, and profit per booked night together, plus ADR and occupancy where they are available.
- Compare properties using the same period and the same definitions.
- Note unusual one-time items before drawing conclusions from a change between periods.
Spreadsheet vs. operating system
A spreadsheet can work well for a small operation. One property, a manageable number of stays, and an owner who touches every expense personally may be a reasonable fit for a careful sheet; switching tools for its own sake is not an improvement.
With multiple properties and repeated periods, more attribution and review is required on both sides. Expense categories can drift as they are retyped. A stay that spans two months needs a consistent rule. Month-over-month property comparison may mean rebuilding the same view by hand, which creates opportunities for inconsistencies.
For a field-by-field foundation, see the short-term rental spreadsheet guide. For the record-keeping side before tax time, see the Airbnb bookkeeping guide.
Supply costs and standards connect naturally to the vacation rental inventory checklist.
How Blueprint shows profitability
Blueprint presents profitability from what you record, for the reporting period you select. The Profitability view shows Recorded Revenue, Recorded Expenses, Recorded Net Profit, Recorded Profit Margin, and Recorded Profit Per Night, followed by contribution by property — each property's recorded revenue, booked nights, recorded expenses, net profit, and margin — with a separate row reconciling portfolio or unassigned expenses so every recorded expense is accounted for exactly once. Recorded ADR appears with revenue, and Occupancy for the reporting month appears on the Command Center.
Recorded results stay visibly distinct from setup data. Rates and fees saved during setup are inputs; ADR and profitability figures are described as recorded, realised from the stays and expenses in the period. Where a figure cannot be produced honestly — no booked nights, no revenue, or incomplete expense data for the period — Blueprint says so instead of substituting a configured rate or an assumed cost.
The limitations are as specific as the capabilities. Blueprint does not import bank or card feeds, reconcile accounts, categorize transactions automatically, or match platform payouts, and it does not connect to Airbnb, Vrbo, a PMS, a calendar, or a financial account. It does not calculate investment returns, ROI, cap rate, net operating income, RevPAR, cash-on-cash return, or break-even occupancy, and it does not model financing, debt service, or appreciation. It does not produce tax forms, file anything, or give tax or accounting advice, and it does not audit your books — profitability reflects the revenue and expenses you have recorded, and it cannot know about a cost you never entered.
Final takeaway
Revenue tells you what came in. Profitability starts when the expenses recorded against that revenue are visible too — and property-level attribution is what makes the comparison useful.
Record both sides against the property they belong to, hold the period steady, and review the same handful of figures each month. A complete and consistently attributed record may be more useful than adding a more sophisticated metric.
See profitability by property, from what you record
Blueprint records reservations, revenue, and expenses per property, then presents recorded net profit, margin, profit per night, and contribution by property for the reporting period you select. It is not accounting, tax, or investment software. One-time purchase, no recurring subscription.
More intelligent than a spreadsheet. Simpler than a full PMS.