Short-Term Rental Spreadsheet: What You Actually Need to Track
Most short-term rental owners start with a spreadsheet. It is fast, flexible, and free. But as properties, bookings, and expenses multiply, the spreadsheet often becomes the very thing that hides where the money is going. This guide covers what a short-term rental spreadsheet should actually track, the mistakes that quietly erode profit, and how to know when a dedicated operating system becomes the simpler choice.
A short-term rental spreadsheet should track, for each property and each period, the reservations you took, the revenue you recorded, the operating expenses you paid, the turnovers you completed, and the supplies you restocked. Keeping revenue and expenses attributed to the same property and the same period is what lets you see profit rather than only deposits.
Why hosts start with a spreadsheet
A spreadsheet is the natural first tool for a new host. You list reservations, mark check-in dates, note what Airbnb or Vrbo paid out, and subtract cleaning fees. The barrier to entry is essentially zero, and the flexibility is real: every column can be renamed, every formula rewritten.
For a single property and a modest number of stays, that is often enough. The owner knows the property intimately, can mentally attribute most expenses, and can spot mistakes by eye.
What should a short-term rental spreadsheet track?
A useful spreadsheet separates the money that comes in from the money that stays in your pocket. At minimum, each row should represent one stay or one month for a single property, and the columns should cover the following:
- Reservations. Guest name, check-in, check-out, number of nights, platform, and confirmation ID. This is the operational anchor for everything else.
- Gross revenue. The revenue you record for the stay before subtracting the business expenses you are tracking. Keep this definition consistent across properties and periods so comparisons remain meaningful.
- Payouts. The actual deposit you receive from Airbnb, Vrbo, or direct bookings. Payout timing matters for cash-flow tracking.
- Property-specific expenses. Mortgage, insurance, utilities, property management, and maintenance should be attributed to the correct address, not lumped into one total.
- Cleaning costs. Record each turnover's cleaning fee separately, whether you pay a cleaner or do it yourself. Labor has a real cost even when it is unpaid.
- Turnovers. Track check-out and check-in dates, cleaning status, and any issues reported between guests. This is where operational friction usually appears.
- Supplies. Soap, toilet paper, coffee, linens, and restocking items. These are small individually but material over a year.
- Net profit. Gross revenue minus all attributable expenses for a property and period. This is the number that tells you whether the business is working.
- Profit margin. Net profit divided by gross revenue, expressed as a percentage. It makes properties of different sizes comparable.
- Property-by-property performance. A separate view or tab per property so you can compare occupancy, revenue, expenses, and profit across your portfolio.
Common things hosts miss
Even a well-built spreadsheet fails when the data going into it is misunderstood. Here are the errors we see most often:
Confusing payout with profit
A $2,400 payout feels like revenue. After platform fees, cleaning, supplies, utilities, and mortgage, the actual profit may be a fraction of that. Track both numbers explicitly.
Failing to attribute expenses to the correct property
A single Amazon order or hardware-store receipt can cover multiple rentals. Without a discipline for splitting costs, one property looks more profitable than it is and another looks worse.
Overlooking supplies and restocking
Toilet paper, detergent, and replacement linens rarely arrive with a property label. They are easy to forget, and forgetting them inflates every property's margin.
Failing to distinguish recurring and one-time costs
A new sofa is not the same kind of expense as monthly internet. Mixing them in the same total makes it hard to forecast or compare periods.
Tracking revenue without understanding true profitability
High occupancy and high revenue can still produce low profit. The spreadsheet must surface what stays after costs, not just what came in.
When does a spreadsheet work well?
A spreadsheet is still the right answer when the business is small, the owner is the only operator, and the number of monthly transactions is low enough to review by hand. If you can reconstruct your profit in your head and only use the spreadsheet as a backup record, it is doing its job.
Spreadsheets also excel at one-off analysis: a quick what-if on a new property, a year-end summary for an accountant, or a custom view that no software exports cleanly. Their flexibility is unmatched for ad-hoc questions.
Supplies are the line item most often missing from a sheet entirely. If that is your gap, the vacation rental inventory checklist covers how to set supply standards per property.
Where do spreadsheets become difficult?
The friction usually appears around the second or third property, or when you start delegating turnovers and supply runs to other people. The sheet that once took five minutes a week now takes an hour, and the formulas grow fragile.
Common pain points include: multiple people editing the same file, version-control mistakes, formulas that break when a row is inserted, and the mental work of attributing every expense to the right property and period. The spreadsheet becomes a project of its own.
Spreadsheet vs. Blueprint
The comparison is not about good versus bad. It is about the right tool for the stage of the business. Spreadsheets win on flexibility and upfront cost. Blueprint wins when structure, attribution, and connected views matter more than infinite customization.
- Setup
- Immediate. Open a blank sheet and start typing.
- Guided setup captures business information, properties, rates, standards, and supplies in order.
- Data entry
- Fully manual. Every reservation and expense is typed or pasted.
- Structured forms for reservations, revenue, expenses, turnovers, and supplies.
- Expense attribution
- Depends entirely on the owner's discipline and formula design.
- Each expense is tied to a property and period as it is recorded.
- Profitability view
- Built by hand from revenue and expense tabs.
- Profitability measures are calculated from the recorded stays, revenue, and expenses you enter.
- Supplies / restocking
- Usually a forgotten line item or a separate tab.
- Supplies and par levels are tracked alongside properties and turnovers.
- Turnover coordination
- Manual calendar and checklist outside the sheet.
- Turnovers are recorded with status and linked to properties.
- Priorities
- Not built in. You build your own alerts or ignore them.
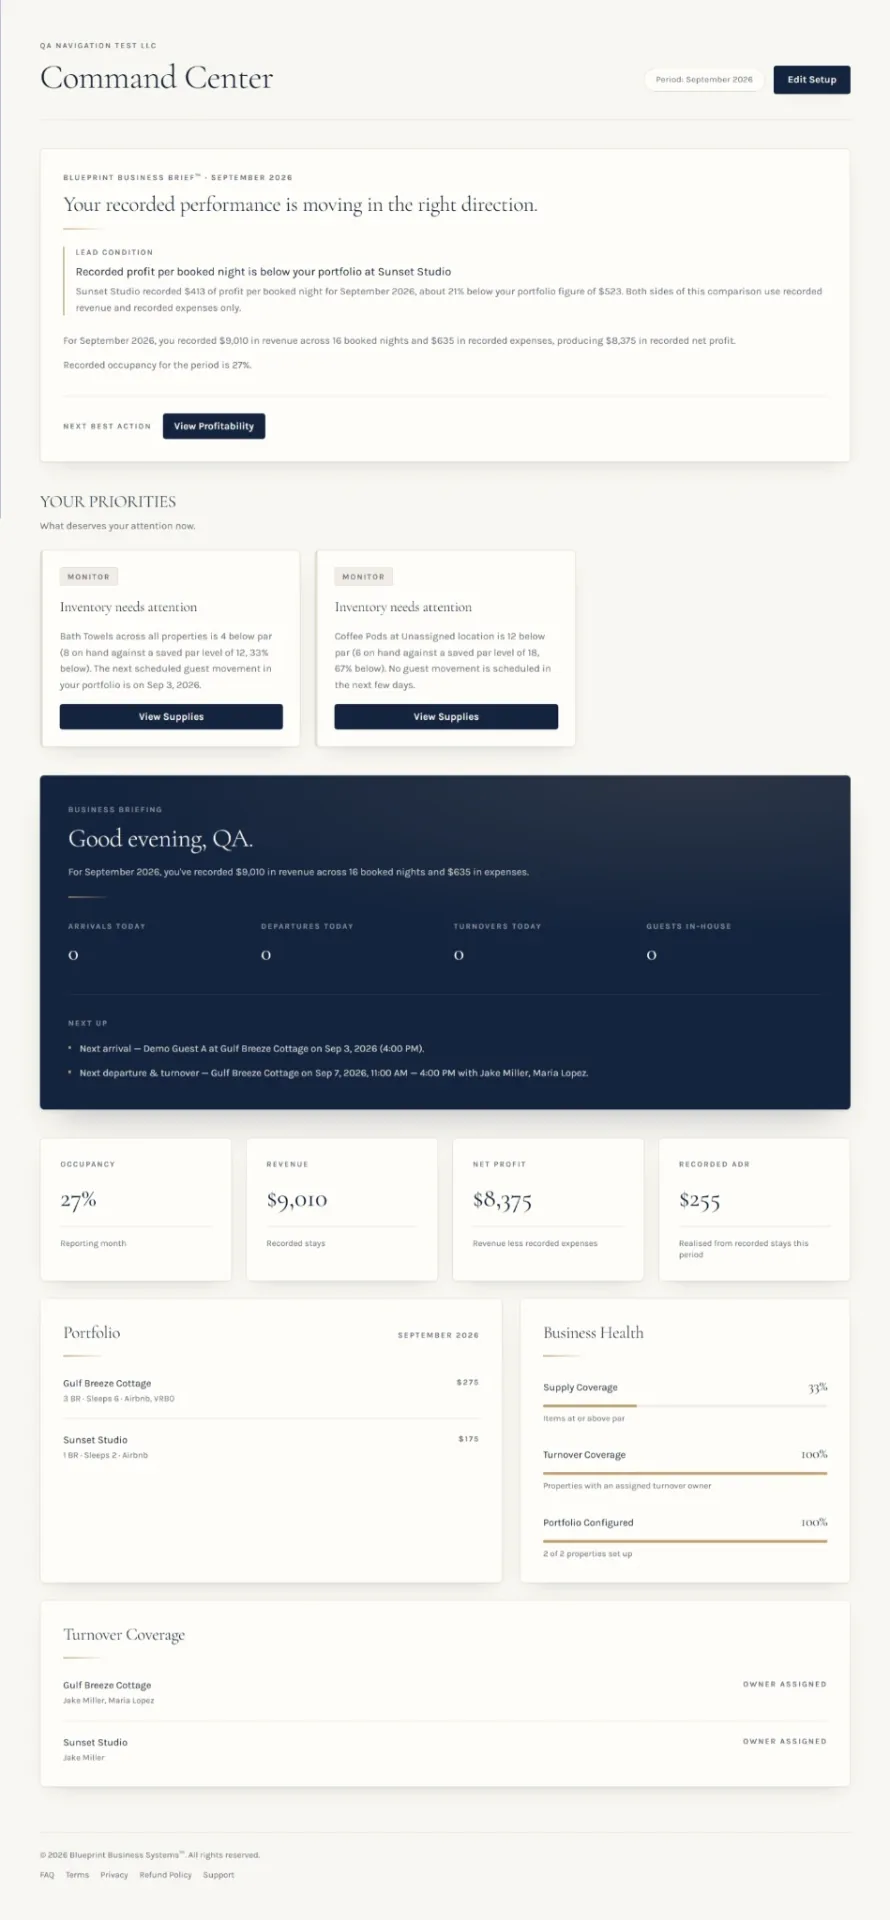
- Command Center surfaces what needs attention based on recorded information.
- Cost
- Free, aside from your time.
- One-time purchase. No recurring subscription.
How Blueprint handles the same work
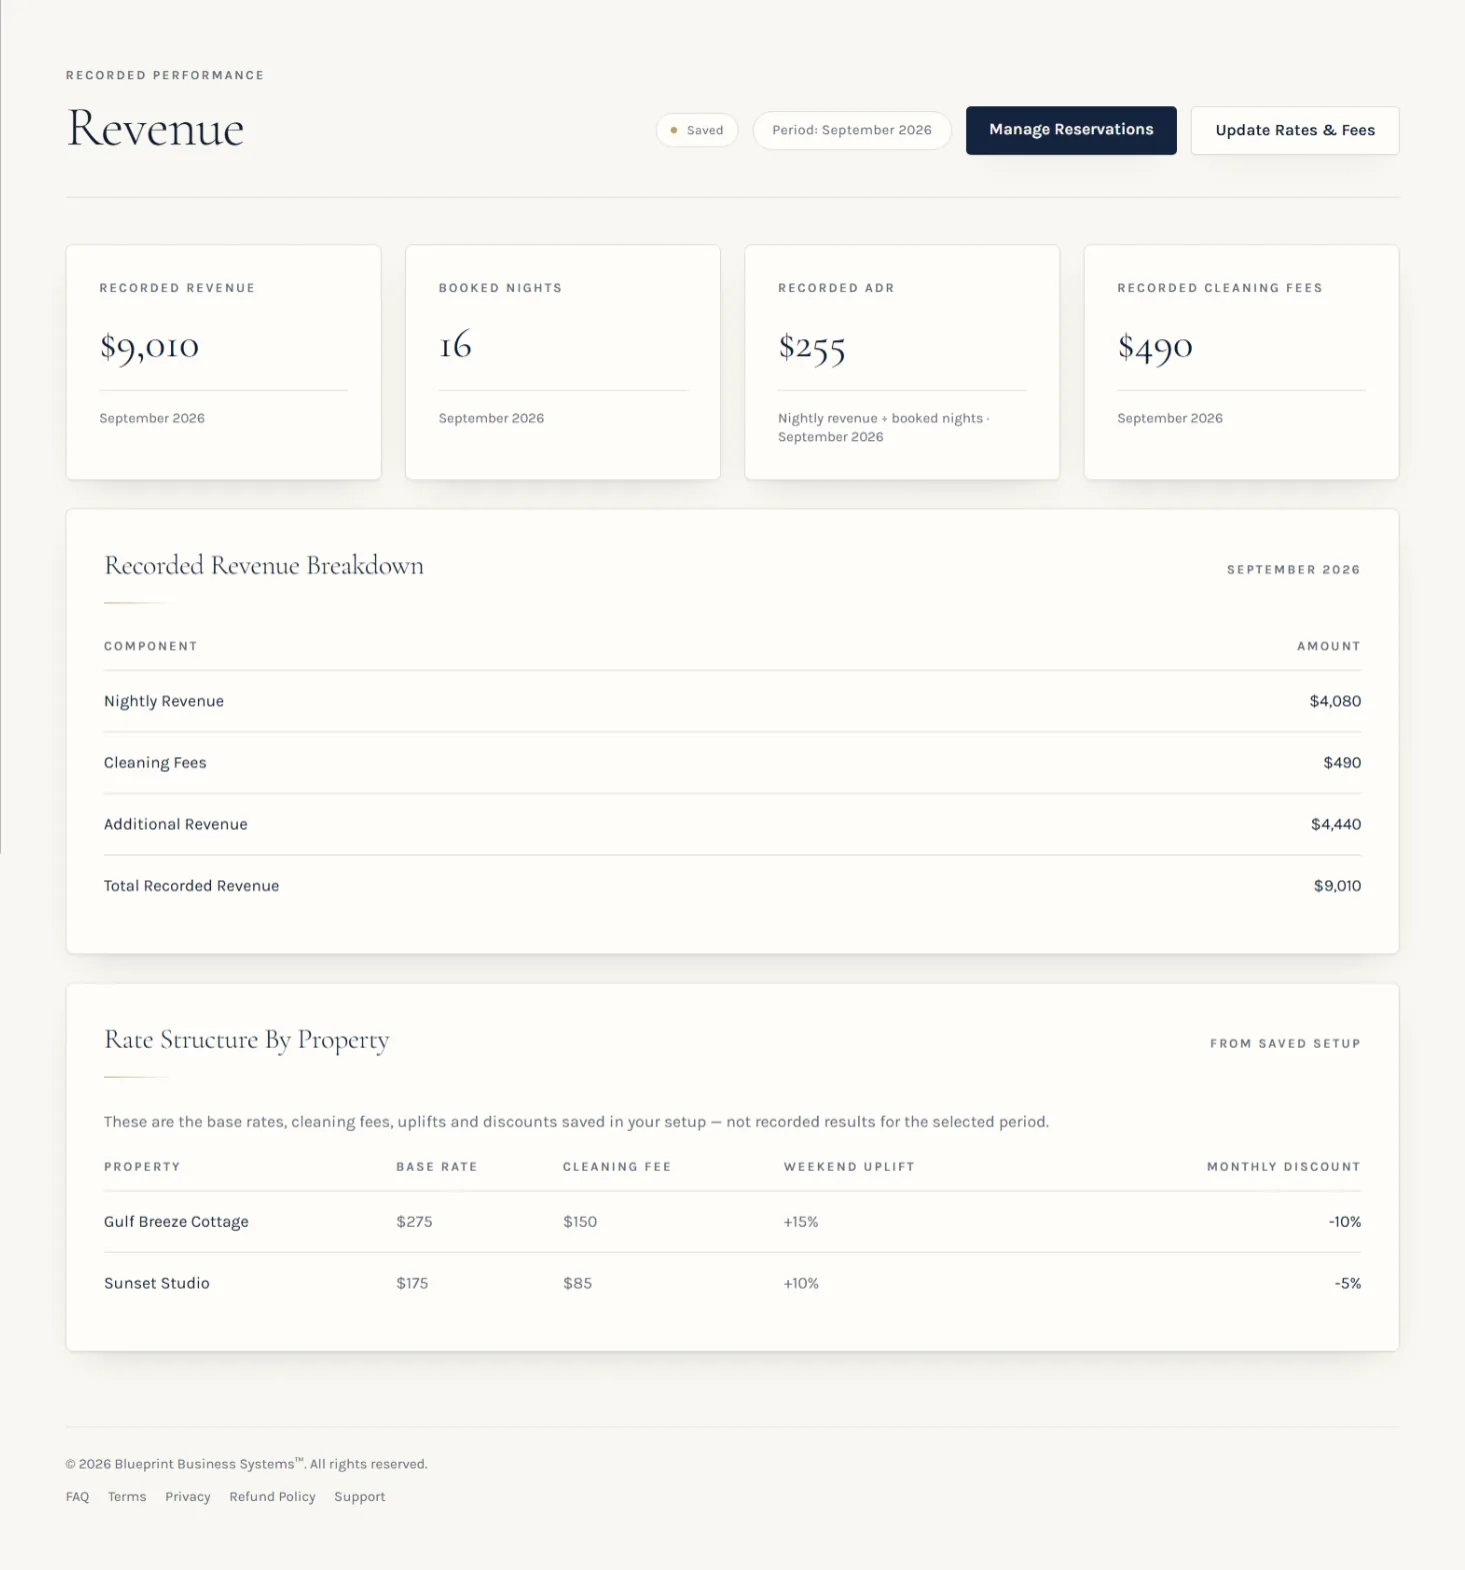
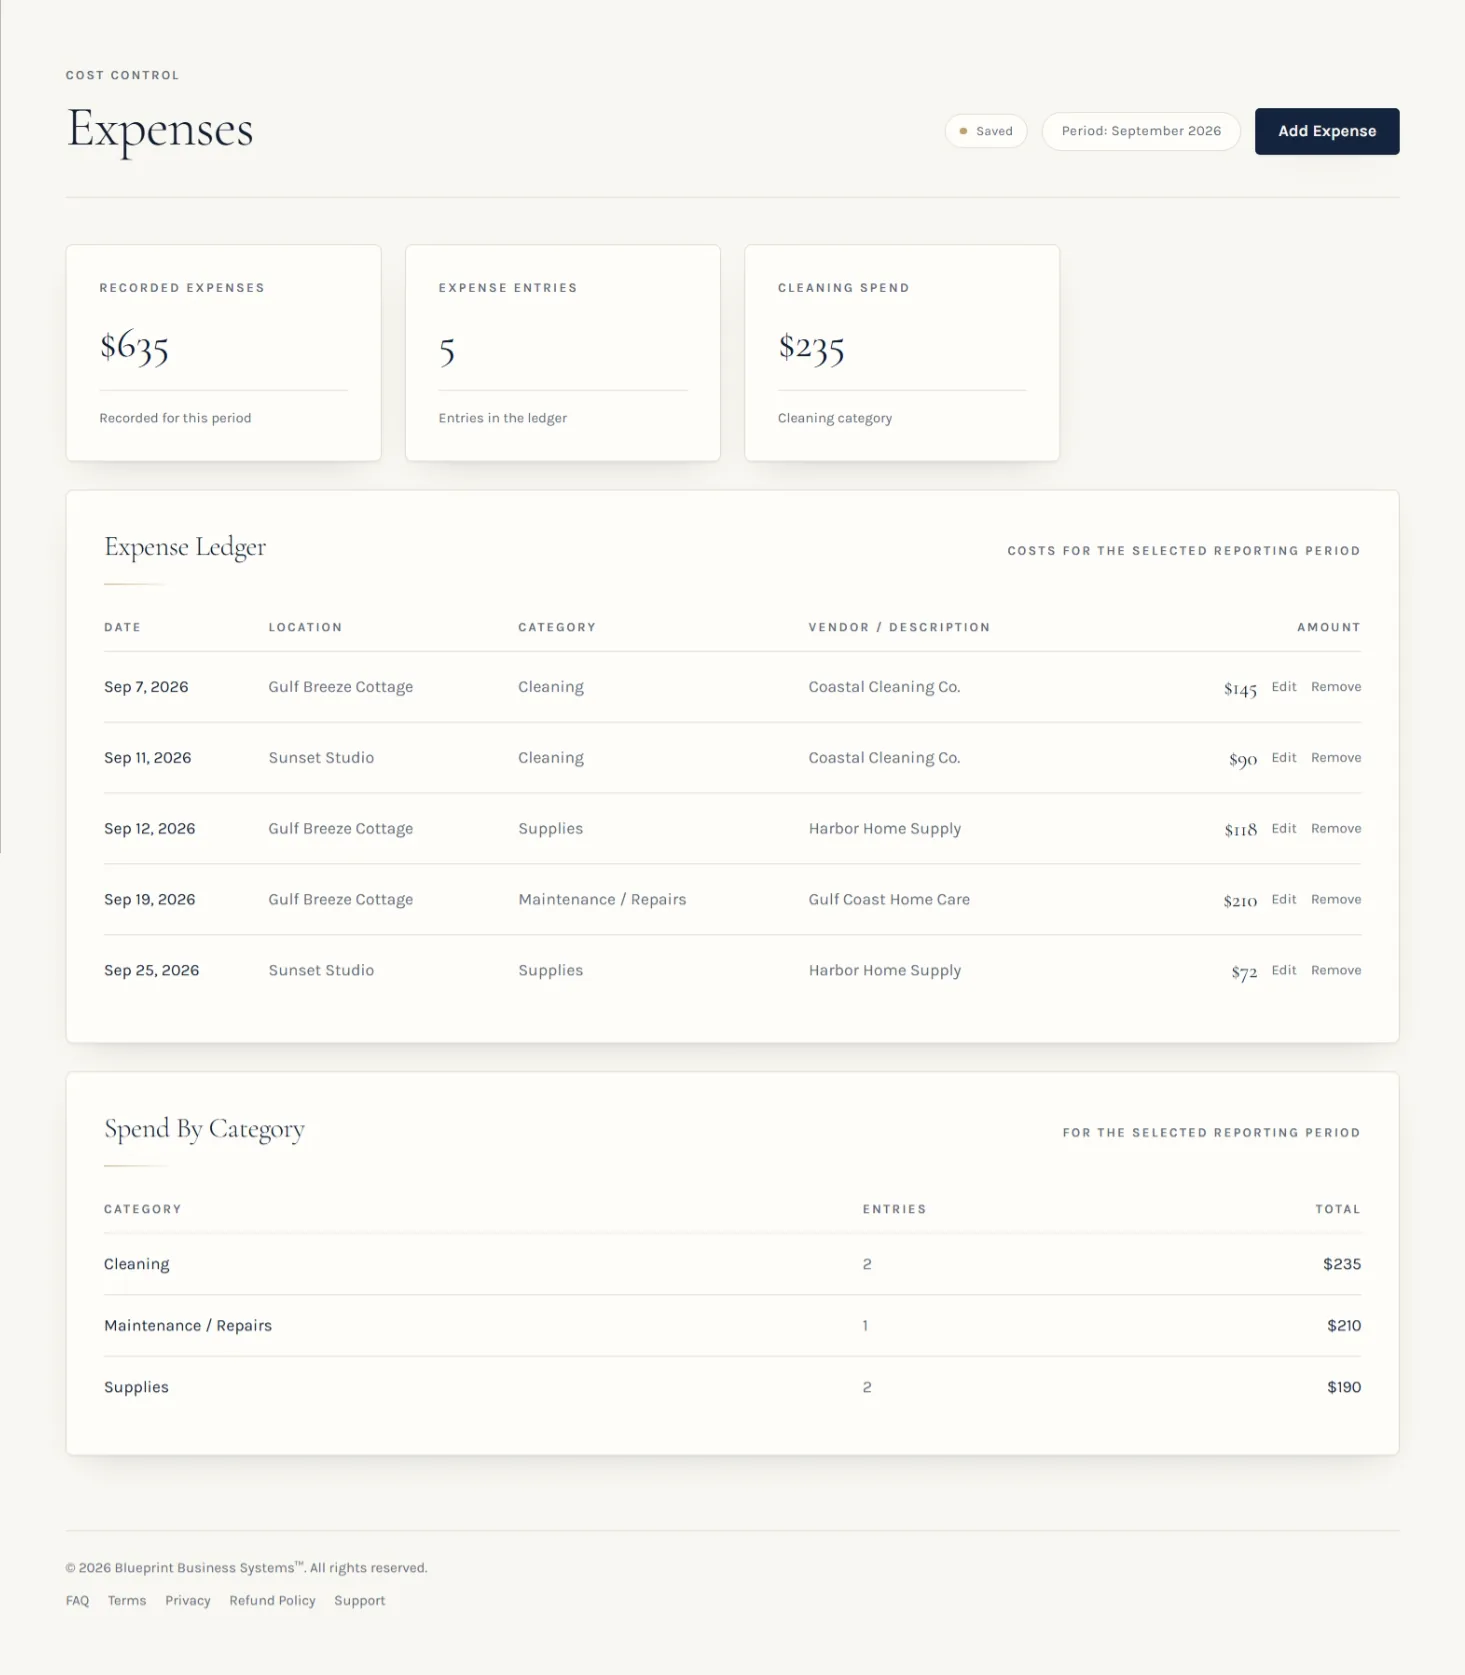
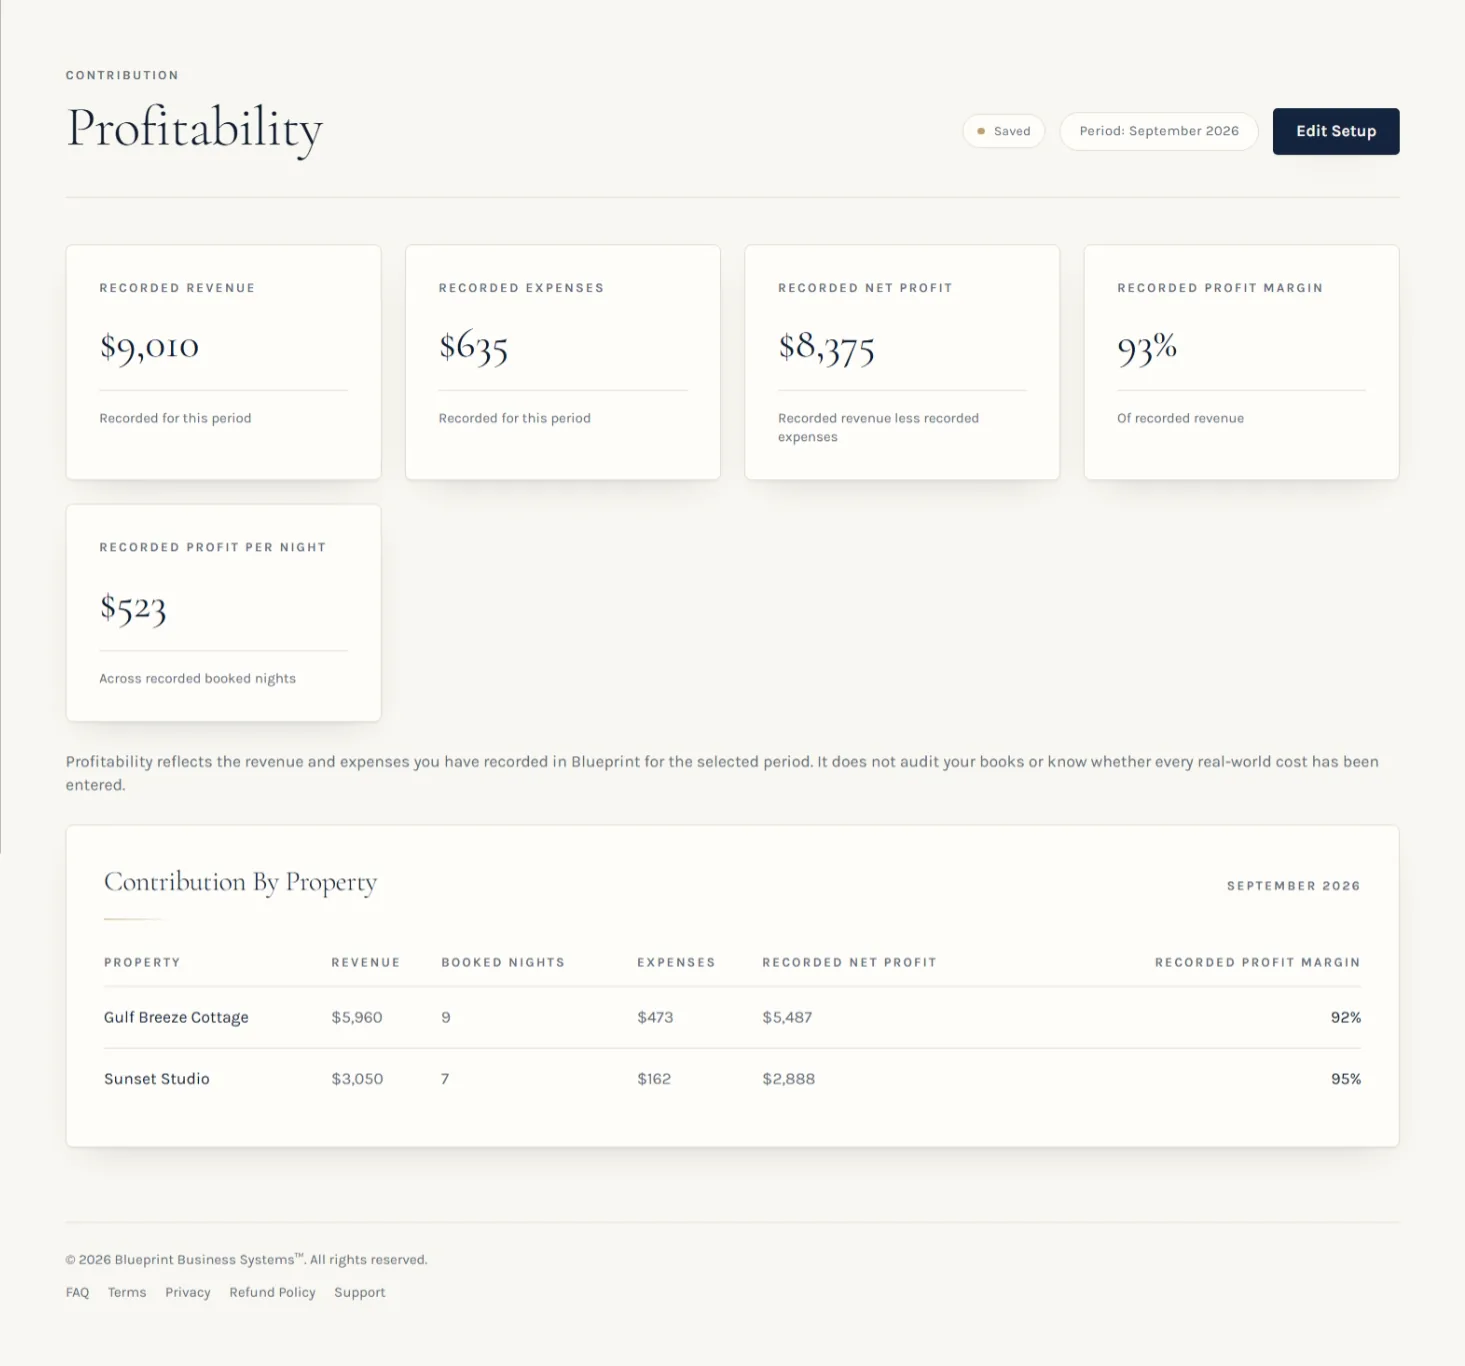
Blueprint was built from the same operational problem: a host who outgrew the spreadsheet but did not want the complexity of a large property-management platform. It keeps the same categories — reservations, revenue, expenses, turnovers, supplies, and profitability — and structures the information you record so the system can present connected operational, financial, profitability, and priority views.
Blueprint connects the reservations, recorded revenue, expenses, turnovers, supplies, and setup information you record in the system and uses that information to present operational, financial, profitability, and priority views.
The views below reflect the reports a Blueprint owner sees after recording business information in the system.
Moving beyond the spreadsheet
The right time to move is not when the spreadsheet becomes annoying. It is when the cost of maintaining the sheet — in time, errors, and missed insight — exceeds the value it provides.
If you find yourself building increasingly complex formulas, creating duplicate tabs to avoid corrupting the original, or spending more time policing the sheet than running the business, the spreadsheet has become a bottleneck rather than a tool.
If your next question is what to keep through the year for accounting, see what hosts should record before tax time.
Ready for something beyond the spreadsheet?
Blueprint connects the reservations, recorded revenue, expenses, supplies, turnovers, and setup information you record into one vacation-rental operating system. It is a one-time purchase with no recurring subscription.
More intelligent than a spreadsheet. Simpler than a full PMS.